
Insights & Analytics
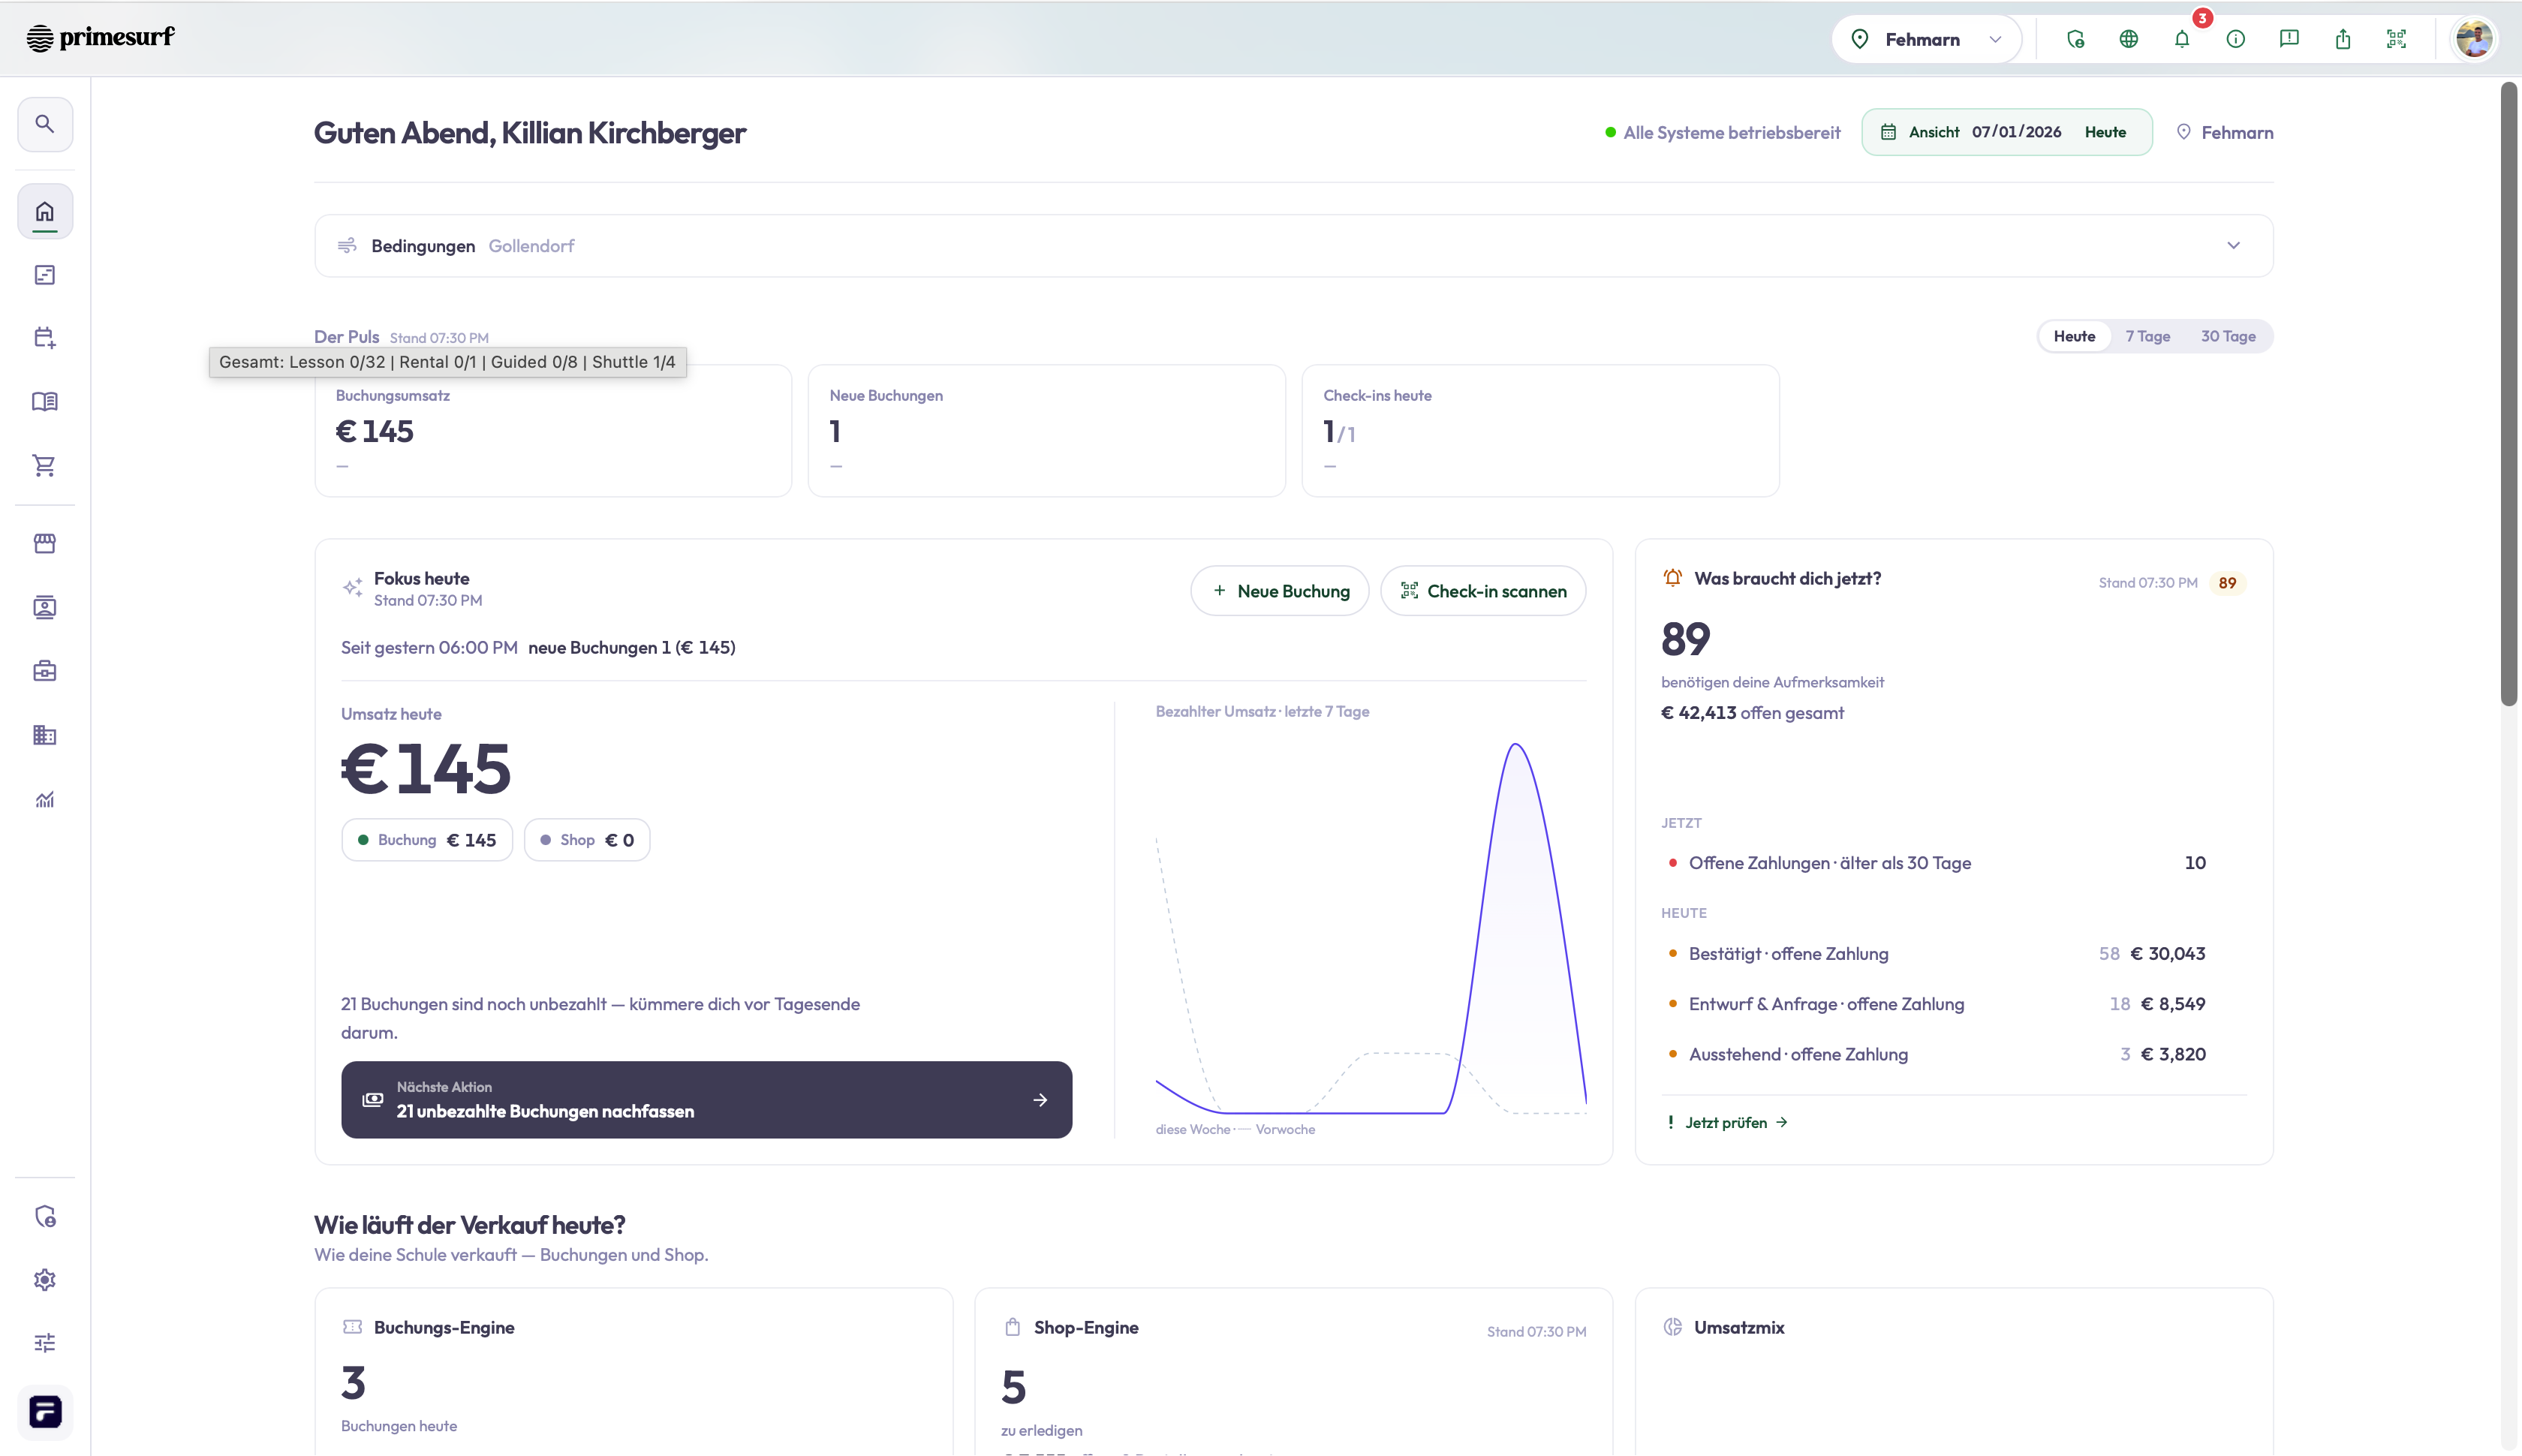
Core capabilityTIDEFORCE turns the bookings, payments and operations already flowing through your school into income, cost, funnel and profit insights
Operational effectyou can see why a season performed the way it did
Read context →
Most outdoor sports schools can tell you what they booked. Far fewer can tell you why the season went the way it did — where customers dropped off before paying, which weeks actually made money once costs were counted, or how one base compares to another. That answer usually lives in exported spreadsheets, pieced together after the fact.
Insights & Analytics reads the data already moving through TIDEFORCE — your bookings, checkout, payments and day-to-day operations — and turns it into a picture of how the school performs. Because it sits on the same connected record as the rest of the platform, you are not reconciling separate systems by hand; the numbers come from the same source your school already runs on. This part of the product is live and evolving: the views described here exist today, and we keep adding to them.
What it does
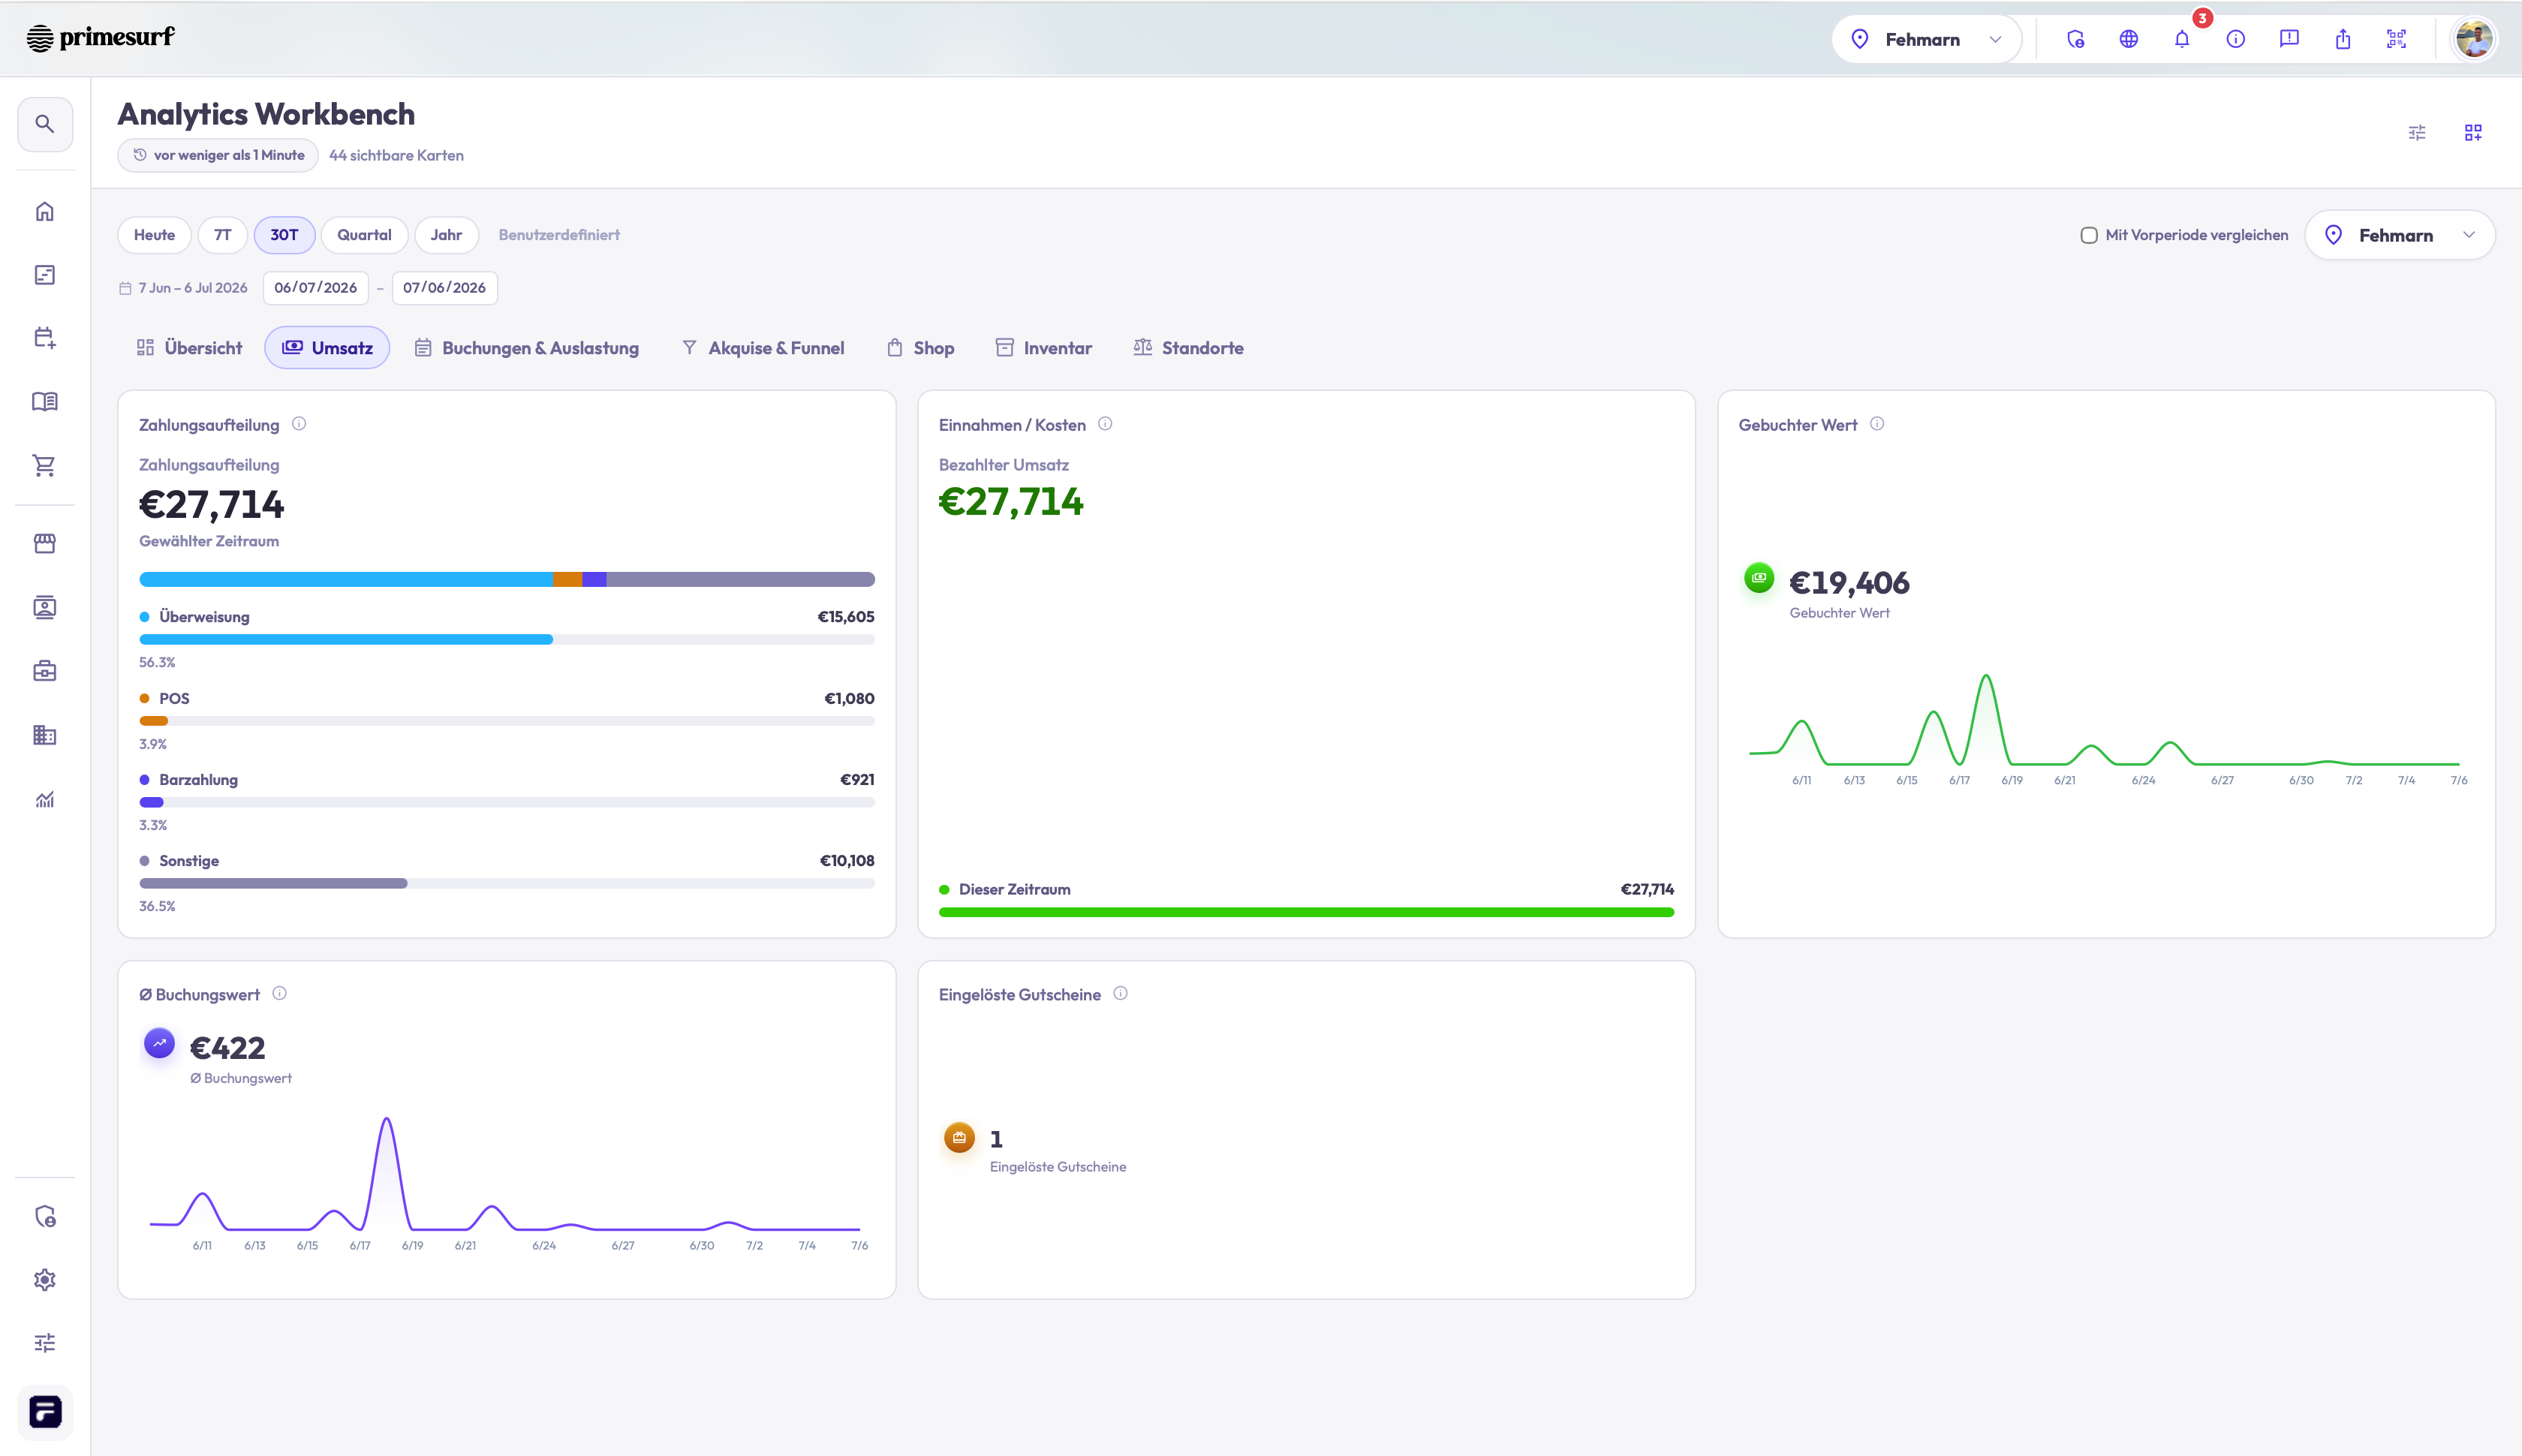
Income and cost
See the money coming in and the money going out side by side,judging the season on revenue aloneRead moreRead less→
See the money coming in and the money going out side by side, instead of judging the season on revenue alone. Income flows from the bookings and payments processed in TIDEFORCE, so the figures track what actually happened at checkout rather than a separate ledger you maintain on the side.
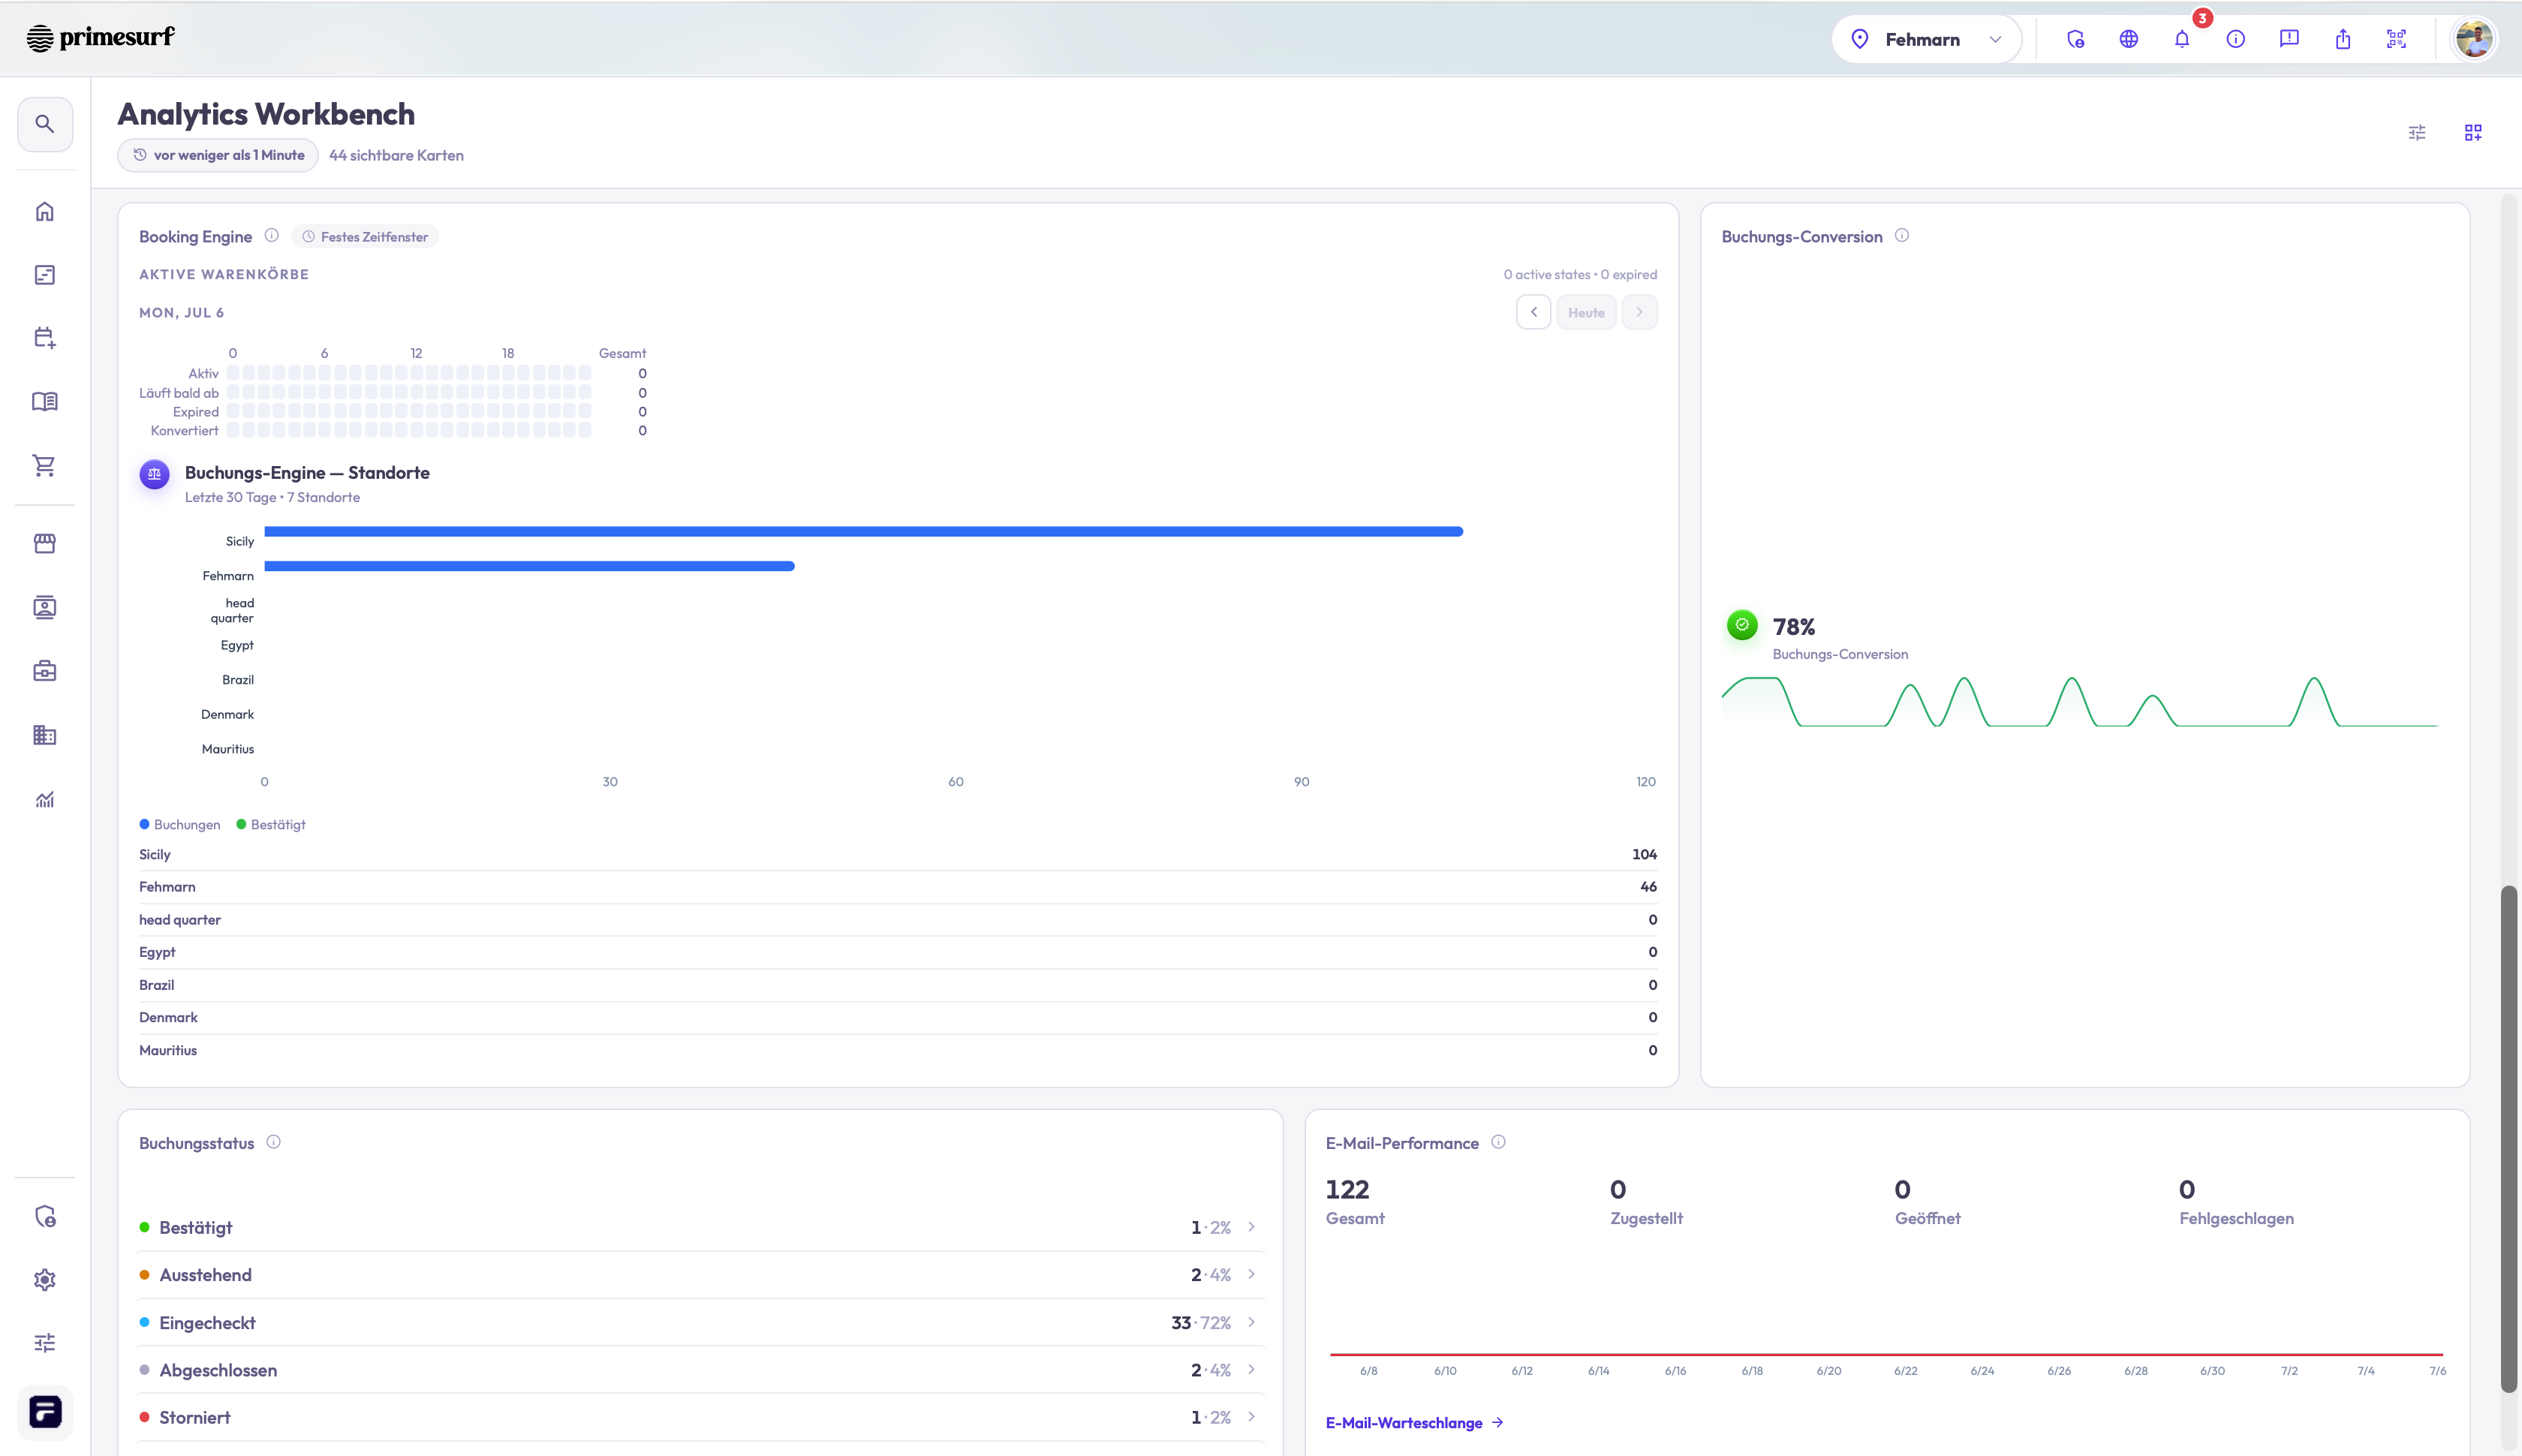
Booking-engine funnel
The funnel view shows how customers move through your booking enginewhere they drop off before they payRead moreRead less→
The funnel view shows how customers move through your booking engine — and where they drop off before they pay. If people are leaving at a particular step, you can see it rather than guess at it, which tells you where a change to your storefront is most likely to matter.
Profit trends
Look at profit over time, not just a single end-of-month totalTrends let you compare weeks and seasons and see the shape of how the school is doingRead moreRead less→
Look at profit over time, not just a single end-of-month total. Trends let you compare weeks and seasons and see the shape of how the school is doing, so a strong-looking month with high costs reads differently from one that genuinely landed ahead.
Operational KPIs
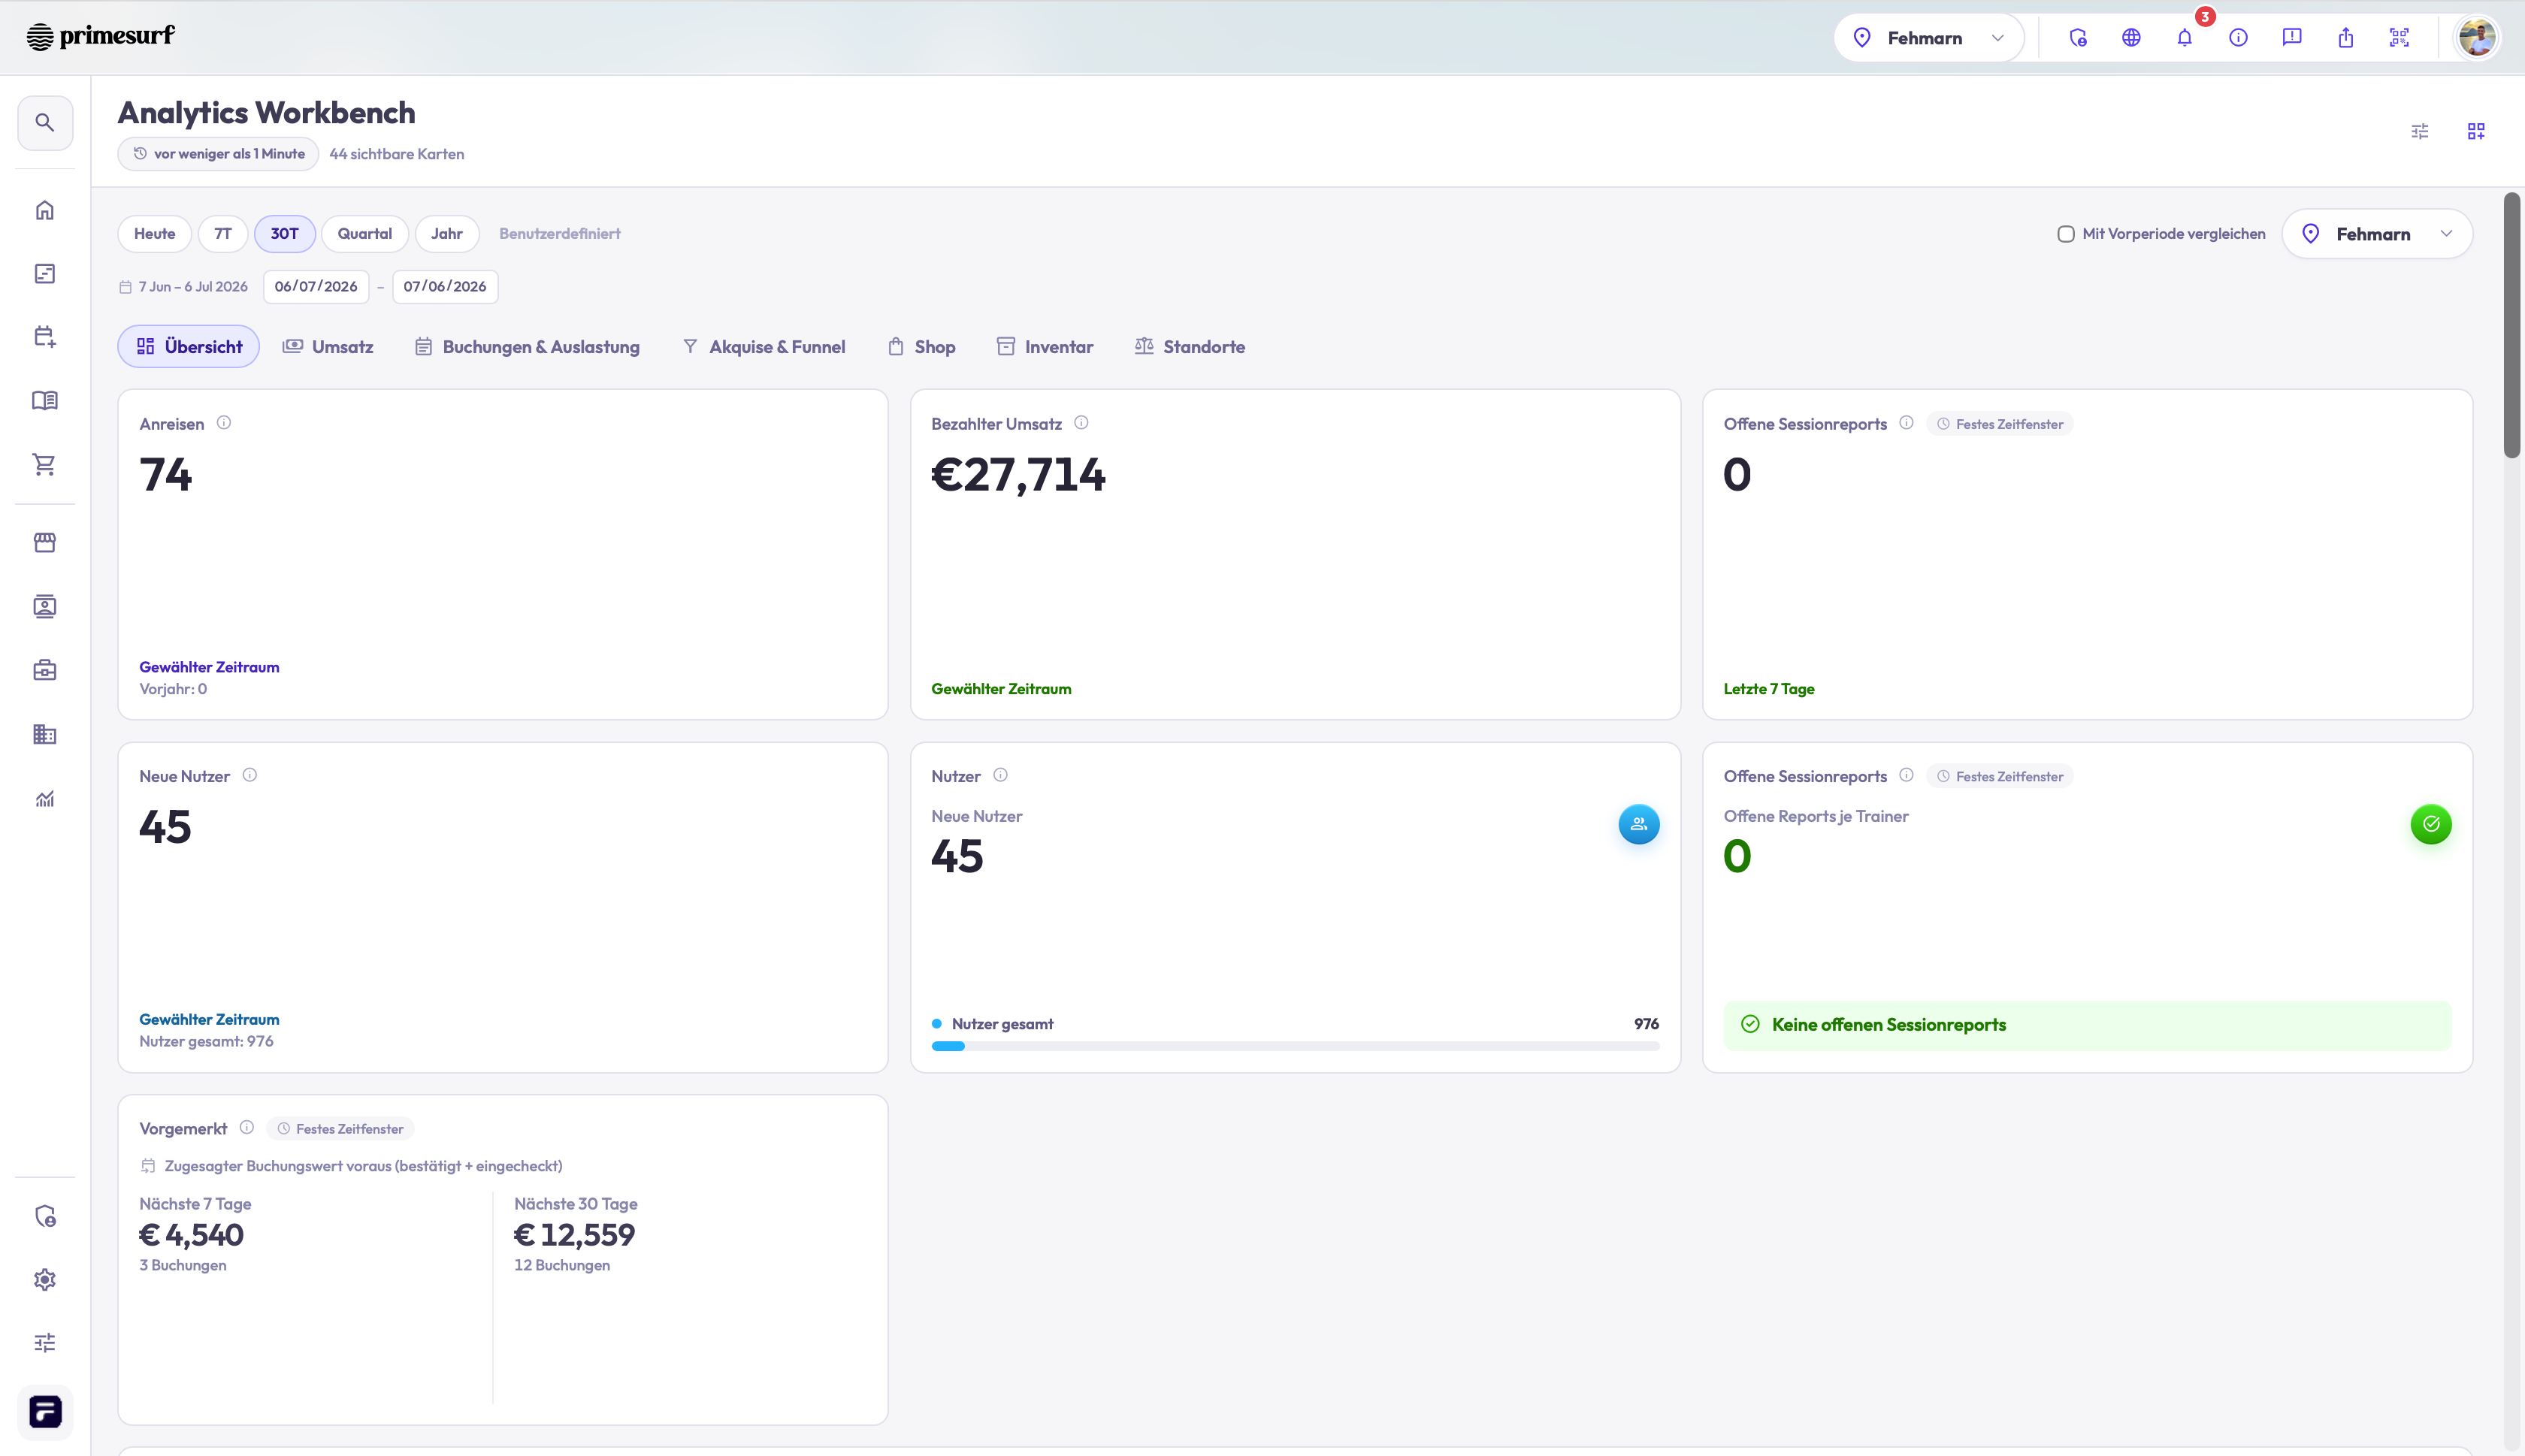
Insights pulls operational signals from the same data that runs your daybookings, sessions and activity across the platformRead moreRead less→
Insights pulls operational signals from the same data that runs your day — bookings, sessions and activity across the platform — so the operational side of the school sits next to the financial side instead of in a separate tool. The set of KPIs is evolving as we build out this part of the product.
Multi-location visibility
If you run more than one base, you get visibility across locationsa separate report per siteRead moreRead less→
If you run more than one base, you get visibility across locations rather than a separate report per site. That makes it possible to compare how each location is performing and see the whole operation in one place.
Read status →
The recap
Read details →
| The question you're asking | What Insights shows |
|---|---|
| Did the season actually make money? | Income and cost side by side, drawn from real bookings and payments |
| Where are customers leaving before they pay? | Booking-engine funnel with drop-off by step |
| Is the school getting stronger or just busier? | Profit trends over weeks and seasons |
| How is the operation running, not just selling? | Operational KPIs from the same connected data |
| How do my bases compare? | Multi-location visibility across every site |
Because Insights reads the same connected record as your bookings, checkout and operations, your reporting reflects what really happened rather than a snapshot you assembled by hand. Pricing across TIDEFORCE is a take-rate of 6.9% per processed transaction, payment fees included, with no setup or monthly fee. Hosting is in the EU on Google Cloud, GDPR-compliant, and your data stays yours. You can go live with your core setup fast, with guided onboarding.
Frequently asked questions
01Where do the numbers come from?
+
From the data already moving through TIDEFORCE — your bookings, checkout, payments and operations. Insights sits on the same connected record as the rest of the platform, so you are not reconciling a separate reporting tool by hand.
02Can I see where customers drop off before paying?
+
Yes. The booking-engine funnel shows how customers move through your booking flow and where they leave before they pay, so you can see which step is costing you bookings rather than guessing.
03Does it show profit, not just revenue?
+
Yes. You see income and cost side by side and profit trends over time, so a busy month with high costs reads differently from one that genuinely landed ahead.
04Does it work across more than one location?
+
Yes. If you run more than one base you get visibility across locations, so you can compare sites and see the whole operation in one place rather than a separate report per location.
05Can I see reviews or my best-performing instructors?
+
Not yet. Customer reviews and ratings, and best-performing-instructor or course-performance dashboards, are on the roadmap and not part of Insights today. We would rather not show a figure we can't yet stand behind.
06Is this a finished, fixed set of reports?
+
No — Insights is live and evolving. The income and cost, funnel, profit-trend, operational-KPI and multi-location views exist today, and we keep adding to them as the product grows.
See how TIDEFORCE fits your school
In a short demo, we'll walk through your real workflows: services, booking, planning, team, guests, inventory, guidebook and shop.

We map your real school day first, then show only where TIDEFORCE actually fits.